


Australian Meteorology through the 20th Century
Introduction
The Origins of Australian Meteorology
Meteorology in the 20th Century
The Weather and Climate of the Twentieth Century
Rainfall
Temperature
Tropical Cyclones
Floods
Droughts
Bushfires
Severe Storms
The Great Weather and Climate Events of the Twentieth Century
A Century of Progress in Science and Service
References
Australian Meteorological Milestones of the 20th Century
Endnotes
Index
Search
Help
Contact us

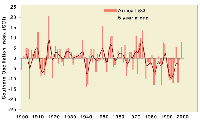
The twentieth century began with Australia still in the grip of the Federation Drought. It witnessed several extended periods of drought and flood associated with the irregular fluctuations of the Southern Oscillation (Figure 6), many dramatic individual weather events in all States and a gradual overall warming trend across the continent. The general features of the twentieth century climate have been described in various publications (Bureau of Meteorology 1989; Zillman 1994; Bureau of Meteorology 2000). Some of the more notable individual events and trends in Australian weather and climate over the century are described in the following pages.
Rainfall
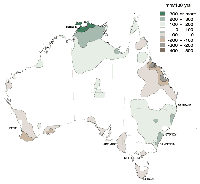
The average annual rainfall over Australia from 1900 to 1999 is shown in Figure 7 along with an eleven-year running mean. The very dry period following Federation and the above average rainfall in the 50s and 70s are clearly evident. Overall, there is a very weak rising trend in total rainfall during the century, although individual districts have experienced much stronger trends, both positive and negative, as shown in Figure 8.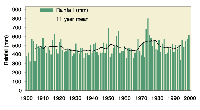
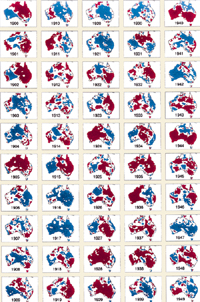
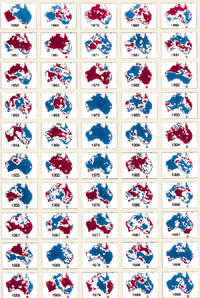
The maps comprising Figure 9 show the distribution of annual rainfall over the continent in terms of the three terciles—above average, near average and below average—for each year from 1900 to 1999.
 |
Bureau of Meteorology |  |
© Online Edition Australian Science and Technology Heritage Centre and Bureau of Meteorology 2001
Published by Australian Science and Technology Heritage Centre, using the Web Academic Resource Publisher
http://www.austehc.unimelb.edu.au/fam/1607.html