

Antarctic Operational Meteorology
Abstract
Introduction
The Past
The Present
The Future
Acknowledgements
References
Index
Search
Help
Contact us

High resolution and TOVS data from the polar orbiting satellites can now be read out at High Resolution Picture Transmission (HRPT) stations in Antarctica (eg Casey) for direct use in local weather analysis and forecasting but are also available to the major numerical analysis centres throughout the world and, in particular to the European Centre for Medium Range Weather Forecasts (ECMWF) located in Reading in UK, the UK Meteorological Office in Bracknell UK, the National Meteorological Centre in Washington USA and the National Meteorological Centre in Melbourne which are all equipped with high computing power and which provide the basic global analysis products including coverage of the high latitudes of the Southern Hemisphere.
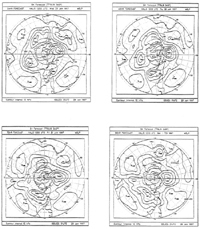
Such products include forecasts of the principal meteorological elements out to around 10 days though with increasing forecast time the products become, of course, less reliable. However, such forecast data fields (eg Figure 17) are of high quality to around 4 to 5 days and are used by National Meteorological Services in all countries for the provision of services to the public. A review of the current Australian global assimilation and prediction system (GASP) is given by Bourke et al. (1995) and Seaman et al. (1995).

Each of the modelling centres has its own suite of models and comparisons of the results and "skill scores" for particular periods are made leading to improvements to individual model characteristics. In general, however, the finer the grid scale or the higher the wave number which a particular model is able to achieve within the computing capacity available to it and the more realistically it is able to parameterise the effects of sub grid scale phenomena such as convection, surface friction, cloud characteristics etc the better will be its predictions.
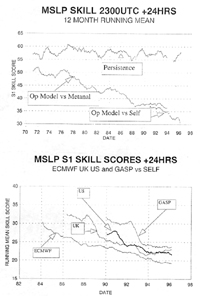
The progressive improvements in the quality of forecasts with the introduction of more refined models having improved physical parameterisations may be shown in Figure 18 for global forecasts made by the Australian and principal overseas analysis centres. Here the skill score sequence over some 15 years is depicted. The so called S1 skill score is derived from comparison of forecast against observed pressure gradients for specific lead times. The lower the score the better the forecast and, as indicated, there has been a significant improvement during the period of record. A recent assessment has been made by Adams (1997) of numerical weather prediction skills over the specific region of the Southern Ocean and coastal East Antarctica extending from 50°S to 70°S and from 80°E to 160°E for the summers of 1993–94 and 1994–95. This indicated that the accuracy of the two models considered was less over this region than for the same models over the Australian region and also that Antarctic forecasters were able to produce minor improvements over the numerical guidance.

The lower panel compares the Australian (GASP) model against those of the equivalent analysis centres, the National Meteorological Centre Washington (US), the British Meteorological Office, Bracknell (UK) and the European Centre for Medium Range Weather Forecasts, Reading UK (ECMWF) (source—Bureau of Meteorology National Meteorological Centre).
Organisations in Australian Science at Work - National Meteorological Centre (NMC)
 |
Bureau of Meteorology |  |
© Online Edition Australian Science and Technology Heritage Centre and Bureau of Meteorology 2001
Published by Australian Science and Technology Heritage Centre, using the Web Academic Resource Publisher
http://www.austehc.unimelb.edu.au/fam/1590.html